While you are twiddling your trackball thumbs waiting for the DACA explosion. something slightly useful.
I finally bought Edward Tufte’s classic of graphical design The Visual Display of Quantitative Information. It’s so good it has no competitors, like the Department of Water Engineering at the Technical University of Delft. [Update 22/22: this is incorrect, see comments.] Struggling to find a niggle against a nearly perfect work, my only complaint is that he compares his masterpiece to Strunk and White’s error-packed The Elements of Style: a “malign little compendium of bad advice” (Stephen Dodson); “the book’s toxic mix of purism, atavism, and personal eccentricity is not underpinned by a proper grounding in English grammar” (Geoffrey Pullum). If you have any serious professional or even amateur interest in charts, buy Tufte’s book: he gets all your money as self-publisher, as commercial publishing houses refused to cede him the full graphical control he demanded. More fools they.
The book lucidly combines general graphical principles on “the revelation of the complex” and a plethora of striking and even amazing examples of good and bad practice. It would be a disservice to offer a dummy’s summary on this blog. What I tried to do was to investigate how much of his specific good advice, as opposed to the general principles, can be put into effect using a standard office software suite. I have LibreOffice. Most of the features apply in Excel, which does offer more: in some case misguidedly, in the 3D pyramid stacked histograms, with a variable lie factor as the data correspond to the heights of the pyramid slices while the eye reads their volume. If you want to make marginal or bubble plots, you will need specialised software like this or this.
I’ll take a worked example. Warning: the page below the fold is large, with many images, pushing the envelope on resolution. The WordPress software seems to muddy the resolution of images so you will need to click on each to get a proper view.
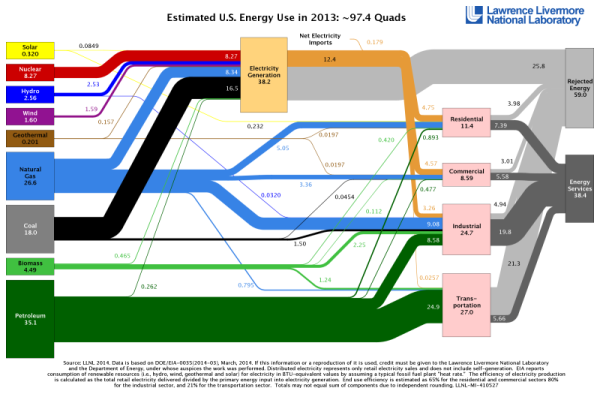
Tufte tells us to choose interesting, rich data. Obvious, but often ignored. I’ll use those from the annual LLNL energy flowcharts for the US economy. Here is that for 2013.
This is itself a fine piece of work. The only thing wrong is that the areas of the total boxes at the right do nor match those at the left. I once located a higher-resolution version, presumably the original, where the boxes are correct. Whoever converted this very large image to png format to fit on a webpage truncated the boxes. Keep control of your work.
They have charts for five previous years. It’s very difficult to compare years. Let’s try to chart the changes between 2008 and 2013, for a subset of key data. I’m especially interested in wasted energy, which happens at the right-hand side.
Let’s start with the popular pie charts. Tufte is against them:
A table is nearly always better than a single pie chart; the only worse design than a single pie chart is several of them, for the viewer is asked to compare quantities located in spatial disarray ….
Here they are. I left the default output of LibreOffice, with few exceptions: the data legends are in bold; the pies were carefully resized so that areas correspond to the true ratios of the data.
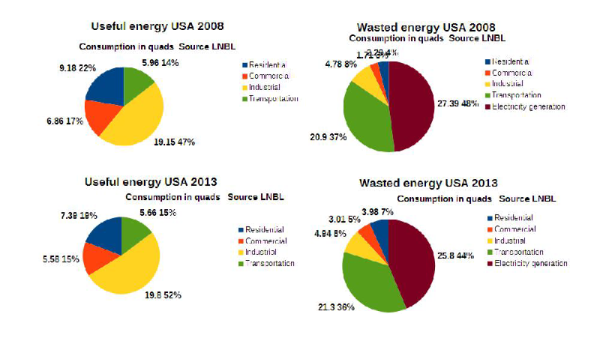
The lesser problems include garish colours, oversaturated so that any legends placed within them are unreadable, and a legend train wreck at the top of the 2008 wasted energy pie on thin pie slices. For some reason the lettering has turned out poorly. The colours can be fixed by editing them; the lettering only by deleting from the chart software and re-entering by hand in a picture editor. The software changed the order of the sectors when I added electricity generation to the waste chart – I’ve no idea how to fix this. (The net output of electricity generation is included in the other sectors, see the flowchart.)
The main problem of difficult visual comparison is unfixable. What would you say is the ratio of useful to wasted energy in either year? The latter is clearly more, but could be by anything from 20% to 60%. The eye is not nearly as good at estimating areas as lengths. The true increase is 40%.
So let’s follow Tufte’s advice and put our 10 data points in a table.
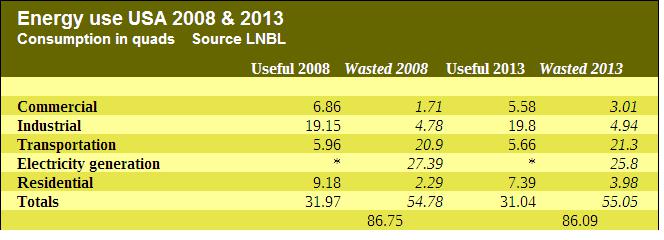
I take issue with Tufte here. A table is fine for at most a double comparison of a set of data: say, within a year between sectors, and between useful and wasted energy. Add a third variable such as time, and it gets confusing. So we will see what we can do with stacked bar charts. Here is the raw default result.
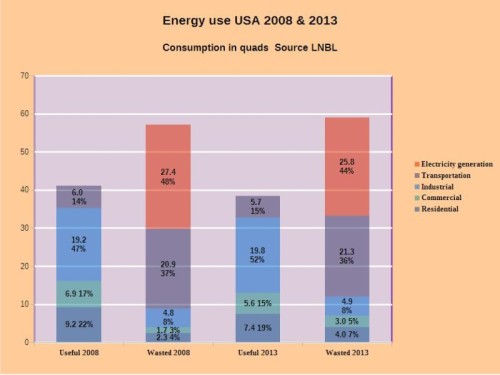
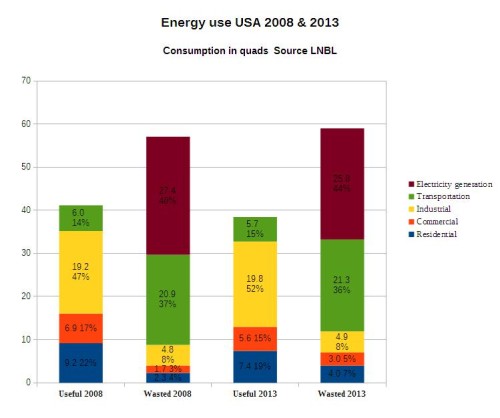 This is already a considerable improvement. It is quite easy to run a visual comparison both between useful and wasted energy within each year (adjacent columns), and of useful or wasted energy between years (alternate columns). The intuitive perception of the ratios of the column heights is much more accurate. All the sectors are in the right order. The software offers percentage bar charts, but what’s the point? The percentages are just as clear visually without them, and the varying height adds another useful datum, the absolute total.
The remaining weaknesses are of visual comfort, elegance and legibility. First we add a white horizontal grid as a discreet reference point – a tip from Tufte. This suggested a pastel coloured background. To make the white lines run through the columns, I made them 50% transparent. You want to start with a well-saturated colour for this to work. I played around with the colours to make an agreeable effect. Tufte does not offer much advice on colours, in this book at any rate. I like pastels, and chose related colours for my four final consumption sectors, and a contrasting one for the electricity waste, a category of its own. I also added data labels within the columns, allowing the precise numbers to be read off directly.
What are the tick labels on the left-hand axis doing? The numbers are already in the columns. So we get rid of them. Tufte suggests, for scatter plots, replacing regular interval ticks on the axes with exact marginal coordinate values; not feasible with ordinary tools. Similarly for truncating the lines of the axes to the data range. Another way of combining numbers with charts is to put a table below the columns, as with this good example from EPIA.
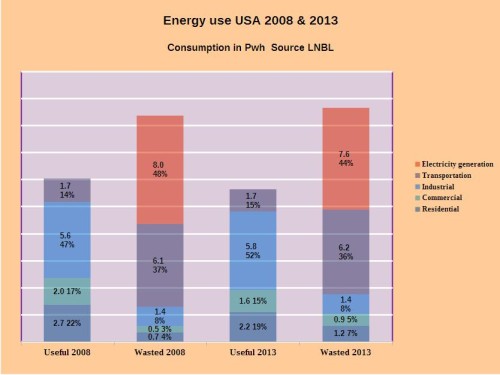
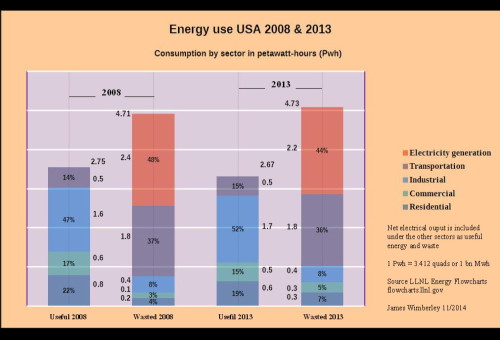
Tufte insists that revision is as necessary for charts as it is for writing. First, I added the column totals, a useful piece of information, using a picture editor (SansSerif PhotoPlus Starter edition - free). More important, I decided to change the units, a substantive not a graphical issue. The quad (quadrillion BTU) is a standard unit for discussing very large quantities of energy, as for the US economy. But it reflects the era of fossil fuels we are leaving for one powered predominantly by renewable electricity. For geeks, the quad is deprecated as not an SI unit. There is no loss in intuitive grasp in shifting to SI. Neither the quad nor the BTU has any day-to-day resonance, unlike the kilowatt, roughly the power delivered by a small horse. (Racing cyclists can sustain 400 watts for a while). The terawatt (trillion watts) is too small as a measure for the US economy, so let me introduce you to the petawatt, a quadrillion watts or billion megawatts. Get used to the prefix: the NSA are already up to exabytes - the next jump beyond petabytes - at their Borgesian Utah data centre. That’s thousands of petabytes of selfies and emails, no more useful (judging by Benghazi and ISIS) than Smaug’s bed of gold. So I recalculated the spreadsheet in petawatt-hours. A small explanation went into the chart.
Finally I decided to replace the data legends manually in the picture editor, allowing the placement I wanted. I added explanations of the electricity issue and the units, and my name as author. Here’s the end product. Not great, but I think a decent piece of work. I fancy I’m not far from the limits imposed by today’s bog-standard software. In a few years my grandchildren will be emulating Hans Rosling’s dynamic bubble plot (2.30 minutes in).
Was it worth the effort? I gained no new insights from the work, and you should not expect any if you emulate. Chart design is all for getting across your thinking about data to your audience, not refining it for yourself. By that standard, I hope I succeeded. Let me know. I’d have liked to add thin line borders to the column segments, but neither LibreOffice nor Excel offer this, and I felt I’d invested more than enough time in the project already.
What are then the points the chart illustrates?
- There is a colossal amount of energy waste, and it’s overwhelmingly in just two sectors, electricity generation and transport. Shift to renewable generation (100% efficient by accounting definition) and electric vehicles (something like 85% efficient plug-to-wheel) and you would save waste, and hence carbon emissions, equal to the entire useful energy consumption of the country, with no other changes in lifestyle or the production basket. Replacing current primary energy production is unnecessary, and it’s the wrong metric. Focus on useful energy and waste. (The accounting convention for renewables and nuclear is incidentally correct. Inefficiencies in the form of unconverted wind and sunlight, and heat from reactors, are absolutely trivial environmentally, unlike the emissions from wasted fossil fuels. Conversion efficiency gains are of course welcome there, and costs create a sufficient incentive to pursue them.)
- US industry is remarkably energy-efficient compared to commerce (including government) and households. How it rates against German industry is another matter.
- Obama’s presidency, in spite of sound policies, has not yet achieved significant reductions in energy consumption and efficiency. Some of these policies, notably the EPA coal regulations and vehicle mileage standards, will of course certainly have a bigger impact in the future.
NCGatSmFcts says
I am just starting Eats, Shoots & Leaves (no idea how to underline here). I hope it will not lead me astray.
flashinjapan says
Renewable-based electricity isn't waste-less by this definition. Much of the rejected energy (25.8 quads in the first figure) from electricity generation comes from transmission loss. In particular, any renewable-based electricity that requires storing electrical power in batteries (e.g. a 100% solar system) will increase rather than decrease the waste rate, all else equal. Also, I'm not sure whether rejected energy in generation includes all rejected energy or only the rejected energy that's theoretically possible to capture. There are physical limits to what fraction of energy in a lump of coal can be turned into electricity, but there are also limits to what fraction of solar energy incident on a surface can be converted into electricity, etc.
JamesWimberley says
The EIA, scarcely a green mouthpiece, gives mean transmission losses for the US grid as 6%. Assume that is incompressible. That's a mere
1.50.75 quads. Double it for electrifying transport, and you are still streets ahead of the fossil system.As I indicated, the reason for the LLNL counting as waste the 60% of coal energy that is not converted into electricity, and ignoring the parallel 80% of solar energy, is that the former represents a real economic and environmental cost. The unconverted free sunlight just heats up the immediate environment, which it would do anyway.
shegedambanza says
Nice post. The other books he has written are also quite good, but the first one-the one you have-remains my favorite. If you're really motivated he has a (I think) day-long seminar that is pretty entertaining. Comes to California in January, I think. And you get a collection of his books to boot.
NoGatorFan says
I agree that VDQI is a very good book.
But stay away from the followups.
They do not contain much new.
And if I had to consult only one book on grammar/style, it would still be Strunk and White.
I'm not saying it's perfect, I'm not saying it doesn't show its age.
I'm saying it compresses basic ideas about writing into something a short attention span reader can manage.
JamesWimberley says
The Pullum/Dodson objection to Strunk and White is not that their advice is outdated, but that it was wrong when it was written. For example they - followed mindlessly by many teachers and the Microsoft grammar checker - condemn the use of the passive voice without an understanding of what is and is not a passive in English.
I've read praise of Style: Toward Clarity and Grace, by Joseph Williams et al. Some good things come out of Chicago, like Harold Pollack.
bighorn50 says
I think ET's distaste for pie charts is derived from work done in the 1970s and 1980s at Bell Labs. It's nicely summarized in Chamber's Elements of Graphing Data (Another book that styles itself after Strunk and White, by the way) or Chambers, Cleveland, Kleiner and Tukey Graphical Methods for Data Analysis. The gist of the argument is that number can represented by geometry in terms of length (or distance), area, or angle. Every statistical graphic encodes data using one (or in dense graphs, perhaps several) of these metaphors. Work with cognitive psychologists showed that human accuracy in evaluation is ordered as above. The drop in accuracy from area to angle is pretty large.
Add to this the ease with which pie charts are screwed up (just look at Excel for plenty of examples of how to screw up a pie chart) and their inability to display more than a few categories clearly and you have a graphic that is questionable. That's certainly the approach that I've taken, but I am re-evaluating my opinions.
I am currently reading and working my way through Leland Wilkinson's The Grammar of Graphics (Second edition). Wilkinson takes issue with the routine vilification of the pie chart. Wilkinson makes it clear that circular graphics have a definite place in the repertoire and are especially appropriate for periodic phenomena. Some of Florence Nightingale's circular histograms presenting health statistics are works of art. I haven't revised my opinion that pie charts are over-used (and prone to distortion), but the old lesson, "Never say never; and never say always," was reinforced.
bighorn50 says
James,
I think The Visual Display of Quantitative Information actually is sui generis. Tufte has a way of appealing to lay readers that nothing else in the market does. When the the first edition came out, some of my friends in the business referred to it as "a coffee table book for statisticians." I had my copy laying out when my parents came to visit years ago. It was no surprise that my father picked it up and read (and admired) some of it. Dad was a perpetually curious man. The revelation came when my mother picked it up and looked through it. A book that could appeal to her was definitely something different.
Chambers' work is aimed at a much narrower audience. Perhaps his Elements comes closest to matching Tufte's ability to appeal to a broad audience. When I compare Chambers' and Tufte's work, it is clear that Tufte's decision to self-publish was correct. The book is beautiful in a way that Elements is not. I suspect this explains some of Visual Display's broader appeal.
firstdano says
I'm a Tuftean and a Presentation Zenean, so thank you for the nice journey.
I read this blog for a reason, and this is an example of that reason.
Thank you James.