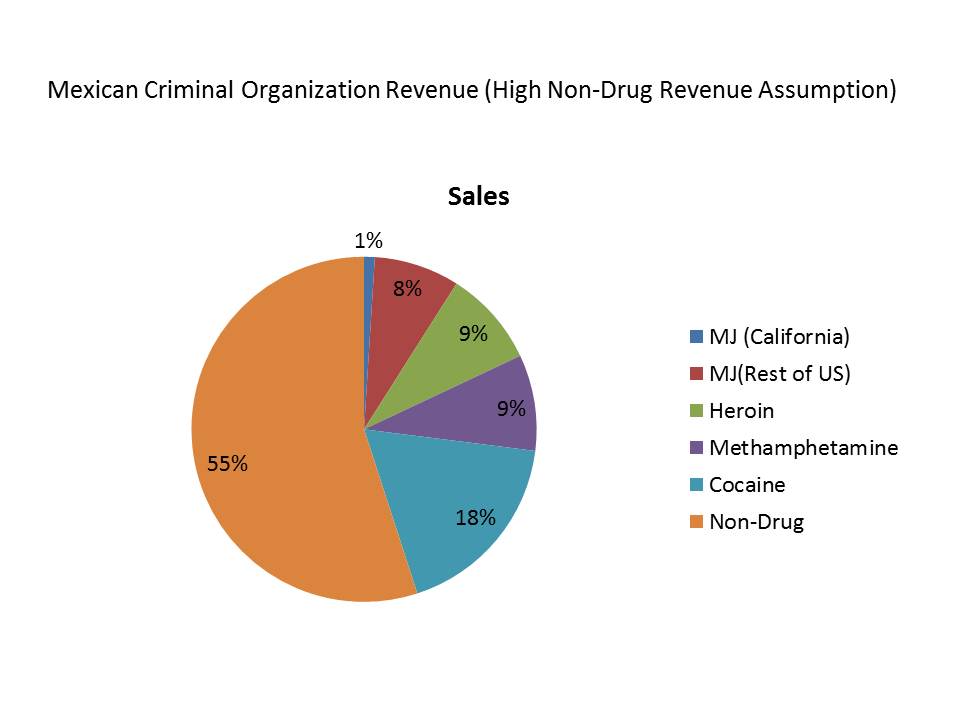
 Starting tomorrow, Stanford’s Center for International Security and Cooperation will host a two-day conference on violence, drugs and governance in Mexico. In preparing for the event (at which Mark Kleiman will also be in attendance), I decided to try to estimate the current revenue streams of the Mexican organized crime organizations (MOCOs). I leaned heavily on RAND research and on the analyses of colleagues in Mexico to generate my estimates, so credit for whatever is correct in these charts goes to them whereas any errors are solely on my own head.
The most difficult thing about getting current revenue streams correct is estimating how much the MOCOs are making from non-drug-related activities (e.g., smuggling immigrants across the border, pirating videos, kidnapping, extortion). Everyone I read or talked to agrees that this line of MOCO revenue is growing, but estimates of how large it is were divergent. The first chart here uses the low-end estimate among experts of 15% non-drug revenue. If this estimate is correct, the MOCOs are still largely one dimensional drug trafficking organizations, with principal profit coming for cocaine. Note that were we mapping drug markets more generally, cocaine would be a much larger share of the pie but because much of that money is made by Colombian gangs, the share for the MOCOs is smaller.
The drug-related pie slices are all based on the national U.S. market revenue, with one exception. Because California had a ballot proposition to legalize marijuana, I have broken out the California marijuana revenue stream separately. It’s about a seventh of the total.
 A minority of experts (e.g., Sylvia Longmire, Edgardo Buscaglia) think that the MOCOs make a much larger share of their money today from non-drug sources. This second chart presents the revenue breakdown if these experts are correct. You can see the differing policy implications, for example even national methamphetamine legalization in the U.S. wouldn’t put much of a dent in MOCO revenue.
A few analytic notes:
*If you want to convert these charts into US dollars, I suggest you use $10 Billion as the size of the overall pie. That could be off a a billion or two in either direction but it’s not a bad estimate, and it makes the math easier.
*If you want to calculate the impact of legalizing a drug under each assumption (high or low non-drug revenue), multiply the relevant pie slice by 80%. The 20% that’s left would be the residual black market, for example from selling heroin to people under 21 in a state that legalized use for those 21 and over. So for example, under the low non-drug revenue scenario, national legalization of cocaine in the U.S. would reduce cartel revenue by 80% of 34% or about 27%. In the high non-drug revenue scenario, legalization of marijuana in California would cost the cartels 80% of 1% or .8% of revenue (i.e., pocket change). If you want to project the impact of an unusually loose legal market, use a higher proportion to reflect a larger impact on illegal revenue (e.g., 90%); if you want to project the impact of a tightly regulated legal market use a small proportion (e.g., 70%).
*Finally, when following media reports about the MOCOs, don’t fall for two common misrepresentations. The first is that the MOCOs are “drug cartels”. The MOCOs are not cartels, they have yet to coordinate production and prices as cartels by definition do and we therefore do not need to take this tactic into account when estimating their revenue. Second, don’t mix up reports of drug revenue with total revenue. Numerous news stories slip back and forth between the two as if they were the same thing, but regardless of who is correct about the level of non-drug revenue, no one thinks it is negligible. MOCO drug revenue and total revenue are therefore different things.