It’s a fact (see previous post) that some big corporations are getting serious about lightening their carbon footprints. There are good lobbies - progressive business groups, consumer activists, ethical investors - trying to increase their numbers. Companies don’t need technical advice from the likes of me on how to cut direct energy inputs; or, if they look one link up the supply chain, into changing the source of their electricity.
But a complete corporate carbon footprint involves the entire supply chain, and here they seem to be floundering. There are lots of partial tools, for instance here, but I couldn’t find anything really systematic. (Corrections welcome.)
I reckon the business consultants who specialise in this are stuck with the wrong mental model. Businesses think about supply chains, which is the way they do business. But supply isn’t a chain, it’s a tree. If a typical firm has 10 suppliers, after seven iterations you have more than the number of businesses in the country. Ultimately, the supply net for any company or product is the entire world trading economy.
Even a company as big and powerful as Wal-Mart has in practice to set priorities and limit its focus to a manageable number - hundreds not millions - of upstream suppliers. However it needs to measure these local efforts against systematic benchmarks.
Luckily there’s a perfectly sound piece of practical economics sitting in the attic, the input-output analysis invented by the Russian emigré Wassily Leontief around 1949. He belonged to a group of exiles - Isaiah Berlin, Igor Sikorsky, Vladimir Nabokov, Oleg Kerensky - whose achievements give a hint of how Russia might have turned out without the disaster of the October Revolution putsch. ( I suppose we can also blame Tsarist Russia for Ayn Rand.)
I wrote about this three years ago but (sniff) nobody paid any notice so I’ll try again. This time with a worked example, which has the great advantage of providing a reality check on my shaky math (at the end). Spreadsheet with the sources and entrails here.
My example is the British economy in 2003. I’ve reduced the number of industries from Eurostat’s 95 to just five sectors so you can see the machinery better - for actual work you would have to go back to 95, or ideally Leontief’s original 500. But the numbers are real ones, not made up.
We start with a data table of the flows of output by sector, both the intermediate ones to other sectors and the rest to final consumption.
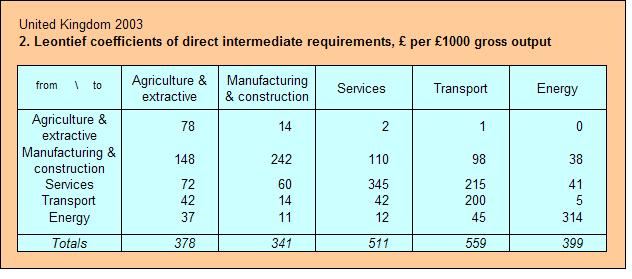
Next we turn these into unit coefficients: each column gives the input requirements for a unit of gross output. These are just the direct flows, not counting the iterations we need to find.
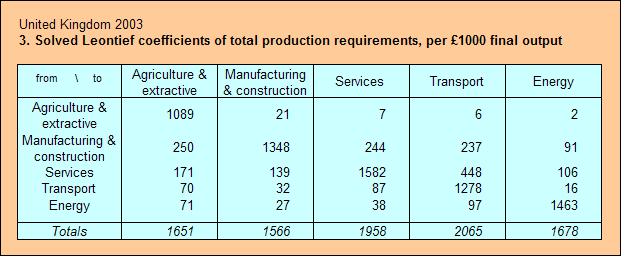
 Leontief’s heroic assumption was that the intermediate coefficients are fixed; the economy works like a single machine. That allows us (or rather our golems Excel and OpenOffice) to calculate quite easily a table of the total requirements for any vector of final output, including the iterations.
 So far the units are in £. To get the carbon intensity, we start with a matched vector of CO2 emissions for the five sectors. The industry definitions in my source data don’t tally exactly, but the match is good enough for broad-brush estimates.
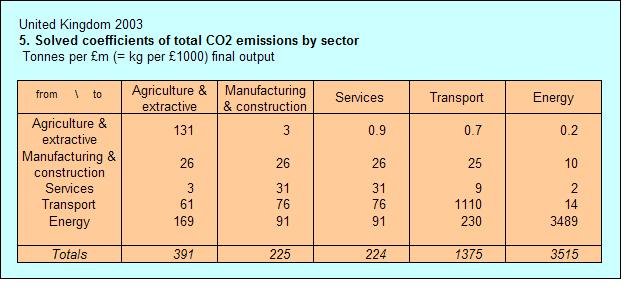
We multiply the Leontief soved input coefficients by these to get a carbon intensity matrix.
 We can multiply any vector of final output by the central matrix of coefficients to get a total carbon footprint for that output. For a single industry, just set all other values of final output to zero. In the Leontief model, we have to use final output - intermediate outputs are endogenous, and varying gross output makes no sense.
Interesting, isn’ t it? Even in this toy model, we can see how the sale of a single insurance policy worth £1000 generates carbon emissions, and we have a first estimate for their size: a fifth of a tonne.
To make this genuinely useful, we need to scale up at least to Eurostat’s 95 industries (example: “agriculture, hunting and related services”), and preferably to the BEA’s 500 or so (example: “tree nut farming”). The energy sector has to be split into all primary sources. Second, we need matched sectoral emissions data - Eurostat’s only matches approximately. And emissions have to be allocated to imports, a tricky exercise involving looking at other countries’ data. All this is well within the capabilities of national and international statistical agencies. They should leap at the chance: it would make all the work they already put into input-output data truly relevant again.
However, a kludged smaller table of 20 or so using existing data would already be helpful. As I’ve found, it isn’t hard to aggregate data from existing sources. You can’t split by guesswork.
Note that I’m not recommending at all that companies and their consultants - not to mention regulators - should throw away they work they are doing on specific supply chains and use this instead. Sectoral input-output data are a starting-point and benchmark. For small businessses, it’s probably the only feasible approach.
*******************************************************************
The math
A is an input-output matrix, where the columns and rows are the same list of industries. (Example: core of Table 2.)
We specify a vector of final output y (example: penultimate column of Table 1), and we want to find x, the vector of gross outputs, including those used up by intermediate processes. I is the standard diagonal identity matrix. The matrix algebra of the model, which I copy from Wikipedia, is quite simple:
x = Ax + y
y = x – Ax = Ix – Ax = ( I – A ) x
x = ( I – A)-1 y
Let the solution matrix ( I – A)-1 be called L (example: Table 3)
The operation referred to by the superscript “-1″ is taking the multiplicative inverse, as 1/5 is to 5. For a matrix, this is a tedious job that requires a computer. Excel’s function MINVERSE has it seems a practical limit of about 50 x 50. If you propose to invert a 500-column matrix, you don’t want my help.
To carbonise the model, we need a vector f of emissions coefficients, in weight per unit value (example: table 4). It’s convenient to transform this into a diagonal matrix F: that is, I with the 1s replaced. (Apart from blinding the rubes with science, using matrix multiplication instead of one-by-one entries is much faster and less prone to error.) Multiply F and L; call the product matrix Z. (Example: table 5). Let c be the vector of total carbon emissions by weight for which each industry’s final output is responsible. (Example: item 10 in spreadsheet.)
Then c = Zy where Z = FL.
Quod erat mostrandum.
Checked-out example in the spreadsheet.


Just as a random interest to very few people factoid-my great-uncle, who was responsible for introducing me to economics, worked as a research assistant to Leontief.
That seems like a lot of work. Why not just install a carbon tax, and raise it until you get the level of carbon use you think is appropriate?
Why not just a carbon tax?
Not all jurisdictions in our globe will implement it, and certainly not in the same way.
Second, to estimate the basic costs of a carbon tax, on a rough cut.
Mark me down as another who just wants a ding-dang straight C tax. When it hurts the poor, do a tax shift. Not hard to imagine. Not hard at all.
If you want a carbon tax that cuts, rather than shifts, carbon emissions, the Leontief analysis will let you figure out appropriate taxes for imported items/components. (Yes, GATT would probably forbid it; I think the politics of ignoring GATT for the US are probably more doable than implementing a carbon tax).
The target for carbon i/o isn’t the legislator directly but civil society: firms, NGOs, individuals, universities…. But greater transparency will also benefit government policy, especially on regulation.
[...] Leontief's trowel for the carbon garden « The Reality-Based Community [...]